

Averaging down shares: when it helps, and when it only adds to the loss
Buying more of a falling share lowers your average price. It does not lower the loss, and if the price keeps falling it makes the loss bigger. The arithmetic, with real numbers.
Calci Editorial · · 5 min read
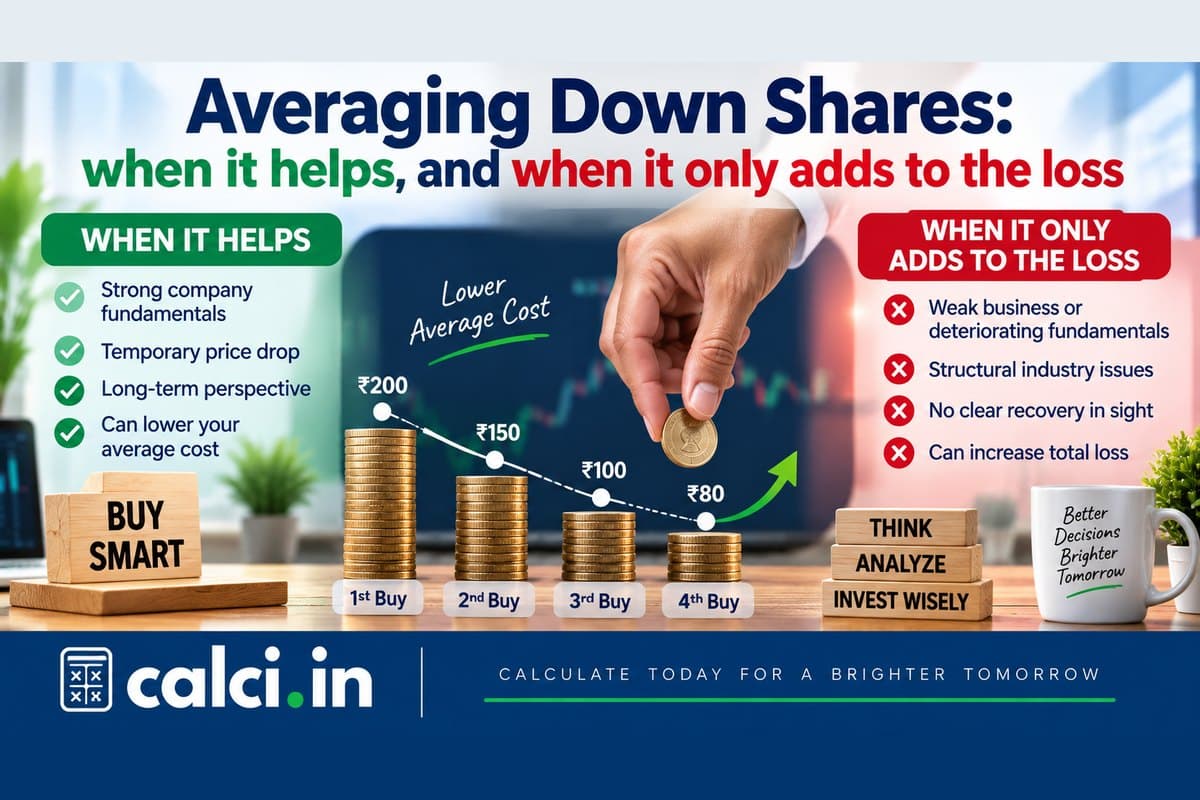
You bought 100 shares at ₹520. They are now at ₹450.
Every trading forum has the same advice for this moment: average down. Buy more at the lower price, bring your average cost down, and you will be back in profit sooner.
Part of that is true. The part that is left out is the part that costs people money.
First, what your average price actually is
Your average price is the total you paid divided by the total number of shares. Not the average of the prices.
Three purchases — 100 shares at ₹520, 50 at ₹480, 50 at ₹455 — cost ₹98,750 for 200 shares. The average is ₹493.75.
Average the three prices instead and you get ₹485. That treats a 50-share purchase as equal to a 100-share one, and it would tell you the holding is ₹3,000 in profit at ₹500 when it is actually ₹1,250 up.
Broker apps get this right. Spreadsheets built in a hurry often do not.
What averaging down does, and the one thing it does not
Back to 100 shares at ₹520, now at ₹450. The position is ₹7,000 down.
Buy 75 more at ₹450. The holding is now 175 shares that cost ₹85,750, an average of ₹490.
Two things changed:
- The break-even moved. The share now needs to reach ₹490 instead of ₹520. From ₹450 that is a rise of about 8.9% instead of 15.6%.
- The exposure grew. You have 175 shares riding on the next move instead of 100, and ₹33,750 more of your money in this one stock.
One thing did not change: the ₹7,000 loss is still there. 175 shares at ₹450 are worth ₹78,750, against ₹85,750 paid. Averaging down moved the finishing line closer. It did not take a single rupee off the loss.
What a target average really costs
The number of shares needed to pull an average of A down to a target T, buying at price P, is:
Shares to buy = shares held × (A − T) ÷ (T − P)
For 100 shares at ₹520, buying at ₹450:
| Target average | Shares to buy | Cost |
|---|---|---|
| ₹510 | 17 | ₹7,650 |
| ₹500 | 40 | ₹18,000 |
| ₹490 | 75 | ₹33,750 |
| ₹480 | 134 | ₹60,300 |
| ₹470 | 250 | ₹1,12,500 |
| ₹460 | 600 | ₹2,70,000 |
| ₹455 | 1,300 | ₹5,85,000 |
Look at how the cost runs away at the bottom.
Getting from ₹520 to ₹490 needs ₹33,750. Going another ₹30 lower, to ₹460, needs ₹2.7 lakh in total — eight times as much. Each new share pulls the average less than the one before, because the holding keeps getting bigger.
A target below the current price is impossible at that price. No quantity of ₹450 shares can drag an average under ₹450.
This table is the most useful thing to look at before averaging down, because it turns a vague "lower my average" into a rupee figure you can say yes or no to.
When the price keeps falling
Averaging down is a bet that the price comes back. When it does not, the extra shares work against you.
Say you bought the 75 shares at ₹450, and the price keeps sliding to ₹400.
| Without averaging | After averaging down | |
|---|---|---|
| Shares | 100 | 175 |
| Average cost | ₹520 | ₹490 |
| Loss at ₹400 | ₹12,000 | ₹15,750 |
| Rise needed to break even | 30.0% | 22.5% |
The break-even is still closer. The loss is ₹3,750 bigger.
Now suppose it falls to ₹380 and the same reasoning kicks in again: buy 100 more to bring the average down to ₹450. That costs ₹38,000. The holding is 275 shares, ₹1,23,750 invested, and at ₹380 the loss is ₹19,250.
A position that started as ₹52,000 in one stock is now ₹1.24 lakh, and the loss has almost tripled from the original ₹7,000. At no point did the average price do anything wrong. It kept falling, exactly as promised.
This is how portfolios get concentrated in their worst ideas.
When averaging down can make sense
None of this means averaging down is always wrong. It means the reason matters.
A fresh look at the business. Ask the question you would ask with no position at all: "Would I buy this share today, at this price, with this money?" If yes, buying more is a normal purchase that happens to lower your average. If the only reason is the average, it is not a reason.
A limit decided in advance. Decide the most you are willing to have in one stock before the price falls, not after. The target table above is the check.
Planned staggering. Buying in tranches over time on purpose — a third now, a third after results — is different from reacting to a fall. The arithmetic is the same; the discipline is not.
Not when something broke. If the price fell because the reason you bought no longer holds — a fraud, a lost licence, a collapsed business line — a lower price is not a discount.
This is not a recommendation to buy or sell anything. It is arithmetic, and the arithmetic cuts both ways.
Tax works on lots, not averages
The average is the right number for judging a position. It is the wrong one for tax.
For shares in demat form, each purchase keeps its own cost and date, and shares are sold first in, first out. Sell part of an averaged-down holding and the oldest, most expensive lot goes first.
From the three-purchase example: sell 100 shares at ₹500. Your average is ₹493.75, so it feels like a small profit. But the 100 shares sold are the first lot, bought at ₹520 — so for tax you have booked a ₹2,000 loss. The 100 shares left are the ₹480 and ₹455 lots.
Listed shares held more than twelve months are long-term: gains above ₹1.25 lakh in a financial year are taxed at 12.5%. Held twelve months or less, gains are short-term and taxed at 20%.
Because each lot has its own date, one averaged-down holding can contain long-term and short-term shares at the same time. Selling first in, first out decides which you are realising.
Where these ideas come from
Averaging down is arithmetic, and the arithmetic in this post is not in dispute. What is worth reading elsewhere is the behaviour around it.
The Securities and Exchange Board of India's investor portal carries the regulator's own investor education material, including the risks of concentrating a portfolio and of adding to a position on the way down. It is written for individual investors rather than for the people selling to them, which is unusual enough to be worth the time.
The calculator here will tell you your new average price. Nothing will tell you whether the company deserves the money, and no formula on this site pretends to.
The stock average calculator works out the average price across your purchases and tells you exactly how many shares, and how much money, a target average needs. To judge how an investment has actually performed over time, the CAGR calculator annualises the return, and the ROI calculator gives the plain return on what you put in.