

SIP vs lumpsum: which investment strategy wins?
The evidence says invest it all at once. The evidence also says most people should not. Both of those are true, and the reason is not about returns.
Calci Editorial · · 6 min read
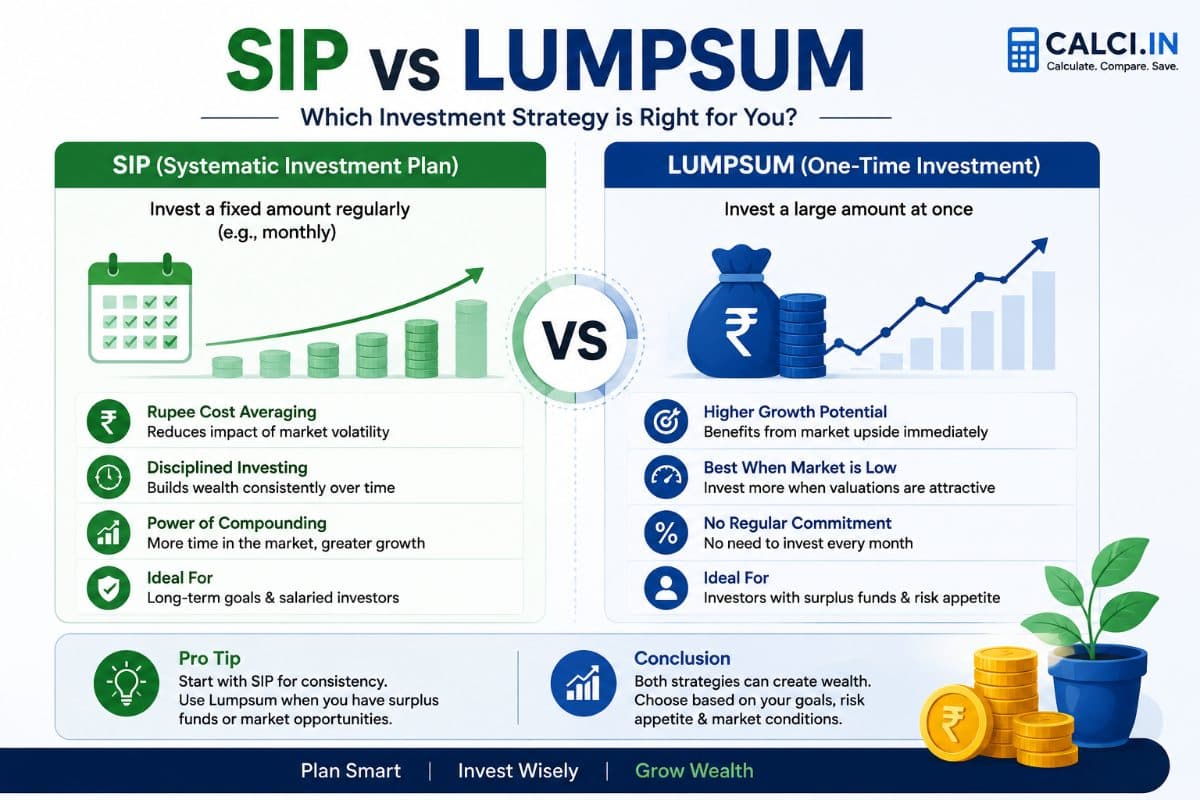
Someone gets a bonus. Or sells a flat. Or a fixed deposit matures.
And then they ask the internet whether to put it in all at once or spread it over twelve months, and the internet gives them a very confident answer that is not quite right.
Let me give you the confident answer first, because it is true, and then explain why it is not the answer to your question.
Lumpsum usually wins
Markets go up more often than they go down. Money sitting in a savings account waiting for a better entry point is money earning 3% instead of whatever the market did.
Studies across long periods and several markets find that investing a lumpsum immediately beats phasing it in roughly two thirds of the time, and the margin grows with the horizon.
The arithmetic is not subtle:
| ₹10,00,000 at 12% | Value |
|---|---|
| After 5 years | ₹17,62,342 |
| After 10 years | ₹31,05,848 |
| After 15 years | ₹54,73,566 |
| After 20 years | ₹96,46,293 |
Every month that money is not invested is a month it is not compounding. Spread it over a year and you have given up, on average, about six months of returns on half the amount.
So: invest it now. Done.
Except.
Why the statistic does not settle it
"Wins two thirds of the time" also means loses a third of the time, and the losses are not evenly distributed. They are concentrated in exactly the scenario that ends investing careers: putting your entire windfall in three weeks before a 35% drawdown.
The two-thirds statistic averages your outcome across a thousand parallel universes. You get one.
And the question is not really "which produces a higher expected return". Everyone knows the answer to that. The real question is: what will you do if the market falls 30% the week after you invest?
If the honest answer is "sell", then spreading the money out is worth more than the return it costs. Because the largest risk to your outcome was never the market. It was the sale.
That is not a maths problem. No amount of backtesting addresses it.
SIP is a different thing entirely
Here is where most of the confusion comes from, and it is worth being blunt about.
A SIP and a lumpsum are usually not competing options. They answer to different money.
A SIP is what you do with income — a salary arrives monthly, so it gets invested monthly. There is no lumpsum decision to make.
A lumpsum is what you do with capital — a bonus, a maturity, a property sale.
Someone with a monthly surplus and an annual bonus should be doing both, into the same funds, for the same reasons. There is no conflict.
The comparison only becomes a real decision when you have a lumpsum and are considering drip-feeding it in — which is the phased-entry question above, not the SIP question at all.
What a SIP actually does
Since we are here, the arithmetic is worth seeing, because it makes a point that a lumpsum cannot.
Tip: The SIP calculator handles step-ups, and the lumpsum calculator takes the same money the other way — run both on your own figure.
₹10,000 a month at 12%:
| Years | Invested | Value |
|---|---|---|
| 15 | ₹18,00,000 | ₹50,45,760 |
| 20 | ₹24,00,000 | ₹99,91,479 |
Five extra years. Six lakh more invested. Forty-nine lakh more at the end.
That is not the SIP being clever. That is the last five years of a twenty-year plan doing most of the work, because by then the balance is large enough that returns on it dwarf new contributions.
Which has an uncomfortable corollary: stopping a SIP in its final years costs disproportionately — and those are precisely the years when a large accumulated balance makes people nervous enough to stop.
The comparison people actually want
Fine. Same money, same period, both ways.
Invest ₹18,00,000 as a lumpsum today at 12% for 15 years: ₹98,52,418.
Invest the same ₹18,00,000 as ₹10,000 a month over those 15 years: ₹50,45,760.
The lumpsum nearly doubles the SIP.
But this comparison is rigged and everyone quoting it knows why. The lumpsum investor had eighteen lakh on day one. The SIP investor did not — that was the entire reason they were doing a SIP.
Comparing them is comparing having money with not having money. Of course having money wins.
The comparison that is real: given that you have ₹18 lakh right now, all at once or over twelve months? And there the answer is the two-thirds statistic, plus your honest assessment of your own nerve.
A position I will defend
For most people, most of the time:
Invest it immediately if the horizon is over ten years and the amount is a modest share of your net worth. A ₹3 lakh bonus into an allocation you already hold is not a market call. It is a top-up. Stop overthinking it.
Spread it over six to twelve months if it is a windfall large enough to change your life — a property sale, an inheritance, an exit. Not because the maths favours it. Because a bad start on the largest sum you will ever handle does damage that is not financial, and the return you give up is a reasonable price for not making the worst decision of your life in month three.
Park it in a liquid fund first if it arrived with grief attached. Three months of doing nothing costs very little and prevents most of the decisions people regret.
Anyone telling you there is one correct answer is answering a maths question. You are asking a different one.
The assumptions underneath all of this
Every number above rests on 12%, and 12% is a choice, not a fact.
Indian equity funds have averaged roughly 11–13% over long periods. That average contains years of +40% and years of −30%, and the order in which those arrive changes your outcome even when the average does not.
Run everything at 8% as well. If the plan only works at 12%, it is not a plan.
And none of these figures are after tax, expense ratio or exit load. Equity gains held over a year attract long-term capital gains tax above the annual exemption. An expense ratio of 1.5% against 0.5% over thirty years costs roughly a quarter of the final corpus — which is larger than most of the decisions people agonise over.
Where these numbers come from
The comparison in this post rests on returns that nobody can promise, which is exactly why the source of a quoted return matters.
AMFI publishes scheme-level and category performance for the Indian mutual fund industry, which is where a claimed SIP return can be checked against what the category actually did. SEBI's investor portal sets out how returns must be presented to investors and what a fund is and is not allowed to imply about future performance.
Neither source will tell you whether a lump sum beats a SIP over the next five years. What they will tell you is the range the answer has historically sat in, and the honest version of this comparison is the range rather than the winner.
Both approaches have their own calculator: the SIP calculator handles monthly investing including step-ups, and the lumpsum calculator does single amounts. If you are working backwards from a target instead, the savings goal calculator tells you what you need to put in each month — which is usually the more useful direction.