

BMI vs BMR vs TDEE: what's the difference and why it matters
Three acronyms, three completely unrelated things. One is a ratio from the 1830s, one is what you burn asleep, and only one of them is a number you can eat against.
Calci Editorial · · 6 min read
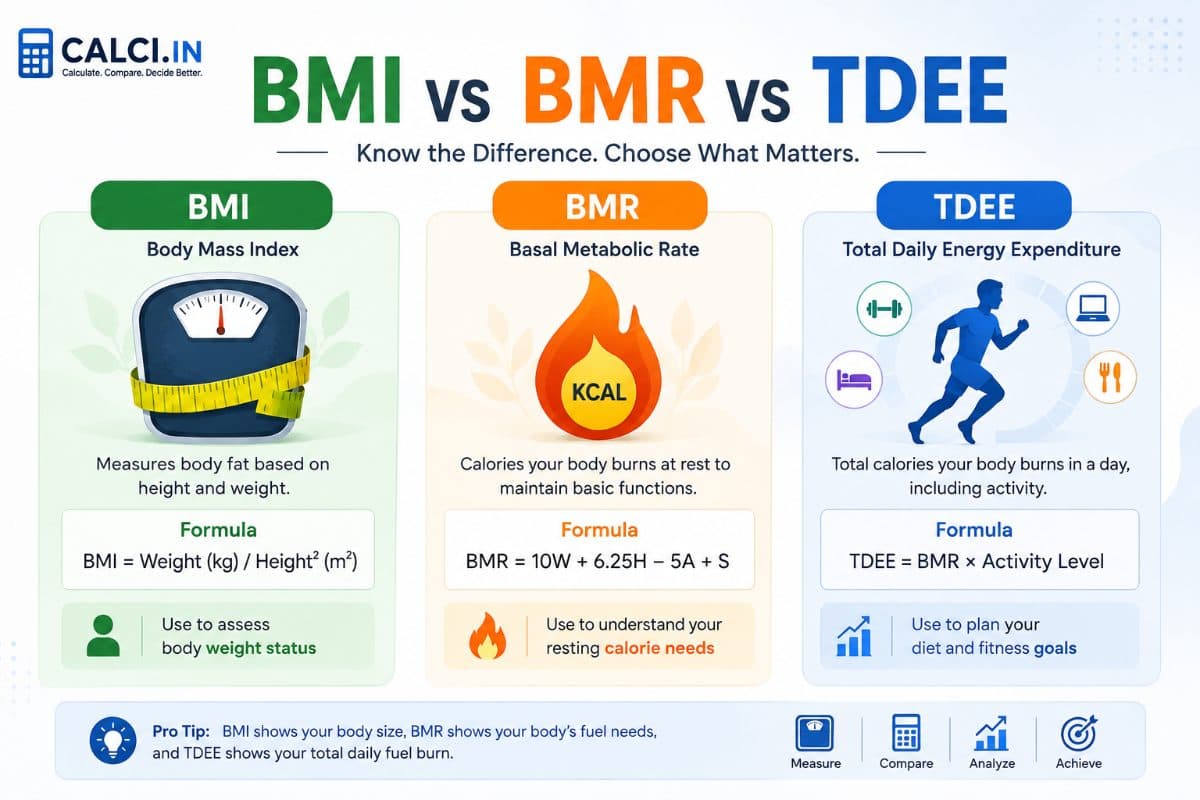
Three acronyms that get used as if they were interchangeable, and are not related at all.
- BMI — a ratio of your weight to your height. Says nothing about what you are made of.
- BMR — what your body burns doing nothing. A number of calories.
- TDEE — what you burn in a whole day. A different, larger number of calories.
Two of those are energy. One is not even in the same units. And only one of them is safe to set a diet against.
BMI: a nineteenth-century population statistic
Weight in kilograms divided by height in metres squared.
An 80 kg person at 1.75 m has a BMI of 26.1. That is "overweight" internationally and firmly overweight under Indian guidelines.
Adolphe Quetelet devised this ratio in the 1830s while studying the statistical distribution of human traits. He was describing populations. He said explicitly that it was not a measure of individual fatness, and he was right.
It became a clinical tool in 1972, when Ancel Keys tested several weight-height ratios against measured body fat and found Quetelet's was the best of a mediocre set — cheap, quick, and adequate at population scale. Keys also cautioned it was for population studies rather than individual diagnosis.
That caution has been ignored for fifty years, mostly because BMI needs two measurements anyone can take and nothing else does.
What it cannot see
Muscle. A rugby player and a sedentary person of the same height and weight get an identical BMI. Most strength athletes read as overweight or obese.
Where the fat is. Two people at BMI 27 have completely different risk profiles depending on whether the weight sits around the abdomen or on the hips and thighs. Visceral fat drives insulin resistance; subcutaneous fat on the lower body is comparatively benign.
Everything else that predicts outcomes. Blood pressure, fasting glucose, lipids, fitness, smoking. None of them are in the formula.
The Indian thresholds are different, and they should be
| Category | WHO | Indian (ICMR) |
|---|---|---|
| Normal | 18.5 – 24.9 | 18.5 – 22.9 |
| Overweight | 25.0 – 29.9 | 23.0 – 24.9 |
| Obese | 30.0+ | 25.0+ |
A BMI of 24 is comfortably normal internationally and overweight under Indian guidelines.
The reason is body composition. At the same BMI, South Asian populations carry more visceral fat and less muscle than European populations. Type 2 diabetes and cardiovascular disease appear at lower BMIs and younger ages. The ICMR put the thresholds where risk actually rises rather than where an international average happened to sit.
If your BMI lands between 23 and 25, the international category is reassuring and the Indian one is not. The Indian one is the relevant one.
Better than either: keep your waist under half your height. No tables to memorise, works across ages and ethnicities, and predicts risk better than BMI does.
BMR: what you burn doing nothing
Basal metabolic rate is the energy your body uses at complete rest — breathing, circulating blood, running the brain, kidneys, liver and heart.
For a 32-year-old man at 80 kg and 175 cm, using Mifflin-St Jeor: 1,739 calories a day.
For a 32-year-old woman at 65 kg and 162 cm: 1,342 calories.
That is roughly 60–70% of total daily energy use, which makes it the largest single component and the natural place to start.
Three formulas are in common use. Mifflin-St Jeor is the modern default. Harris-Benedict dates from 1919 and reads slightly high. Katch-McArdle uses lean mass instead of total weight, which makes it the only one that can tell a muscular person from a sedentary one at the same weight — and the only one that needs a body fat measurement.
None of them is exactly right for you. Measured individual variation is around ±200 calories at typical body sizes. Treat the number as a starting point to adjust from, not a fact about your body.
TDEE: the only one you can eat against
Total daily energy expenditure is BMR multiplied by an activity factor.
Tip: The TDEE calculator gives the daily figure your deficit comes off, in metric or imperial.
For the same man, BMR 1,739:
| Activity | Factor | TDEE |
|---|---|---|
| Sedentary — desk job, no exercise | 1.20 | 2,087 |
| Light — exercise 1–3 days | 1.375 | 2,391 |
| Moderate — genuine training 3–5 days | 1.55 | 2,695 |
| Active — hard training 6–7 days | 1.725 | 2,999 |
| Physical job or twice-daily training | 1.90 | 3,304 |
Sedentary to athlete is over 1,200 calories. Picking one level too high builds a 300-calorie error into every target you set afterwards — enough to erase a modest deficit entirely.
Almost everyone picks too high. The categories are worded generously and people count intention rather than behaviour. An office worker who trains three times a week and otherwise sits is light, not moderate. Three hours of training is a small part of 168 hours.
Choose one level below your instinct and adjust upward only if the weight does not move.
Why the distinction actually matters
Here is the mistake, and it is common enough to be worth stating loudly.
Taking your deficit from BMR instead of TDEE.
Our man has a BMR of 1,739 and a light-activity TDEE of 2,391.
- 20% off TDEE: eat 1,913. A 478-calorie deficit. Sustainable.
- 20% off BMR: eat 1,391. A 1,000-calorie deficit. Not sustainable.
The second one works for about three weeks and then produces muscle loss, exhaustion and a rebound.
Most guidance suggests not eating below your BMR for extended periods, and not below roughly 1,200 calories for women or 1,500 for men without medical supervision — below those levels, hitting micronutrient requirements becomes genuinely difficult regardless of the energy arithmetic.
Which number for which question
"Am I a healthy weight?" — BMI as a rough screen, then waist-to-height ratio, which is better. If you train seriously, ignore BMI and measure body fat instead.
"How much should I eat?" — TDEE, adjusted for your goal. Never BMR.
"Why does my friend eat more than me and stay lean?" — probably TDEE, driven by NEAT: the fidgeting, walking and standing that varies by up to 2,000 calories a day between people and that nobody chooses.
"Am I actually healthy?" — none of the three. Blood pressure, fasting glucose, lipid profile, resting heart rate, sleep, and how you feel at 3pm. All of those predict outcomes better than any of the numbers above, and a full panel costs less than a month of supplements.
The honest summary
BMI is a flawed population statistic being used as an individual verdict. It is worth glancing at and not worth worrying about.
BMR is a real physiological quantity that you should not eat at.
TDEE is an estimate with ±200 calories of variation that you should treat as a starting hypothesis, hold for three weeks, and then correct from your own weekly average weight.
Three weeks of your own data beats every formula on this page.
Where these thresholds come from
The three numbers in this post do different jobs, and only one of them has an international standard behind it.
The BMI categories — and the caveats about what they miss in people of different builds and ethnicities — come from the World Health Organization, which is also where the Asian-population thresholds that matter in India are set out. The US National Heart, Lung and Blood Institute publishes the same ranges for a Western population, which is why two BMI calculators can put the same person in two categories.
Mifflin-St Jeor and the activity multipliers are published equations rather than regulations. They are estimates, and the post above is about how far off they can be.
All three have their own calculator: BMI with both WHO and ICMR thresholds, BMR with all three formulas side by side, and TDEE with the activity multipliers spelled out honestly. If you want the number split into protein, carbs and fat, the macros calculator does that — and body fat percentage is the measurement that makes BMI redundant.