

CAGR vs absolute returns: how to judge investment performance correctly
\"My investment doubled\" tells you almost nothing. Doubling in three years is 26% a year. Doubling in ten is 7.2%. One of those is exceptional and the other is a fixed deposit.
Calci Editorial · · 5 min read
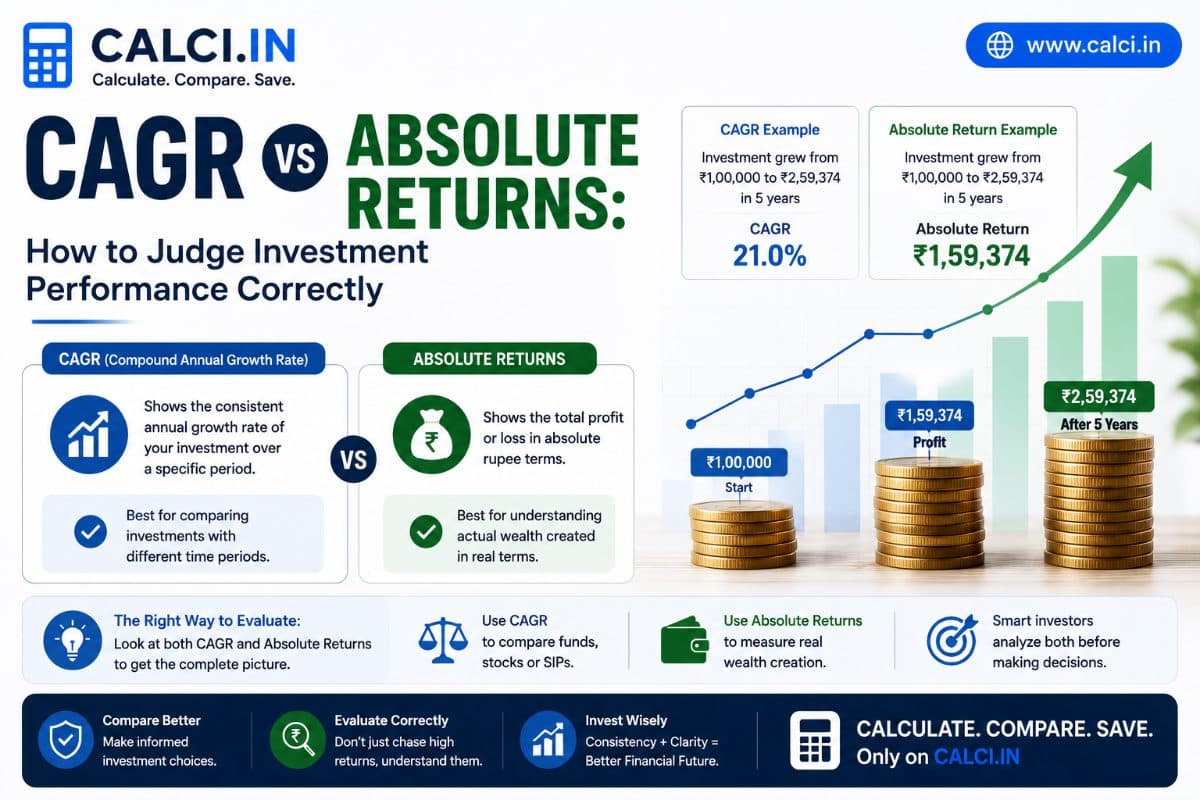
Somebody tells you their investment gave 200% returns.
Your next question should not be "which fund". It should be "over how long".
Because 200% over three years is 44% a year, which would make them one of the best investors in the country. Over ten years it is 11.6%, which is roughly what a decent index fund did while they were not paying attention.
Same 200%. Completely different fact.
The formula
CAGR = (final ÷ initial)^(1 ÷ years) − 1
That is compound annual growth rate: the constant yearly rate that would have taken the starting value to the ending value.
Here is what a single gain looks like at different durations:
| Gain | 3 years | 6 years | 10 years |
|---|---|---|---|
| 50% | 14.47% | 6.99% | 4.14% |
| 100% | 25.99% | 12.25% | 7.18% |
| 200% | 44.22% | 20.09% | 11.61% |
The 50% row makes the point best. Over three years it is excellent. Over ten it is below a fixed deposit — and a bad fixed deposit at that.
Absolute return tells you what happened. CAGR tells you at what rate, and only a rate is comparable across investments held for different lengths of time.
It is not the average of your yearly returns
This is the part that catches people who are otherwise good with numbers.
Tip: The CAGR calculator shows the absolute return beside the annualised one, which is the comparison this whole article is about.
An investment gains 50% in year one and loses 50% in year two. The average of those returns is zero.
The money is down 25%. ₹100 becomes ₹150, then ₹75.
CAGR gets it right because it works from the endpoints, not from the returns: (75 ÷ 100)^(1/2) − 1 = −13.4%. Compound −13.4% twice and you land on −25% exactly.
The arithmetic mean always overstates, and the gap grows with volatility:
| Year 1 | Year 2 | Arithmetic mean | True CAGR |
|---|---|---|---|
| +10% | −10% | 0% | −0.50% |
| +30% | −30% | 0% | −4.61% |
| +50% | −50% | 0% | −13.40% |
| +100% | −100% | 0% | −100% |
That last row is why it matters. A 100% loss cannot be recovered by any subsequent gain, and no average will tell you that.
This is also why fund factsheets quote CAGR rather than average annual return. Any promotional material quoting the arithmetic mean of yearly returns is showing you a better number than the investor received.
Three things CAGR hides on purpose
Volatility, entirely. Two funds both showing 12% CAGR over ten years may have been utterly different experiences — one rising steadily, the other doubling, halving and doubling again. CAGR sees only the two endpoints.
The path, which decides real behaviour. A fund that fell 60% in its third year has a 12% CAGR only for the investor who did not sell. Most did not survive it.
The start date, which somebody chose. If the window ends just after a market peak, the CAGR flatters. If it starts at the bottom of a crash, it flatters more. A fund advertising "18% CAGR since March 2020" has chosen the bottom of a crash as its zero, and that is not an accident.
The defence is rolling returns: compute the ten-year CAGR starting from every month in the fund's history and look at the distribution. A fund whose worst ten-year rolling return is 9% is a different proposition from one whose worst is −2%, even if both average 13%.
Most Indian fund research sites publish rolling return charts and almost nobody looks at them. They are the single most useful discipline available to a retail investor and they cost nothing.
For a SIP, CAGR is the wrong tool
This one produces wrong answers regularly.
A SIP puts money in on many dates. Each instalment has its own holding period, so there is no single "initial value" for CAGR to work from.
The correct measure is XIRR — the annual rate that makes the present value of everything you paid in equal to what you ended with. Every spreadsheet has the function and every fund statement reports it.
Treating total invested as the initial value and running CAGR on it produces a badly understated number, because it pretends all the money was there from day one when the last instalment was in for a month.
Same applies to any portfolio you have added to over time.
Working backwards, which is the useful direction
Rearrange it:
required CAGR = (target ÷ current)^(1 ÷ years) − 1
Turning ₹10 lakh into ₹50 lakh in ten years needs 17.46% a year. That is well above what Indian equity has delivered over most long periods — which tells you the plan needs more time, more contributions, or a smaller target.
Far better to find that out now than in year nine.
Run in the other direction, the same formula converts any promise into a rate you can judge:
- Double in three years → 26% a year
- Triple in four years → 31.6% a year
- Double in five years → 14.9%
The first two are claims to beat every professional fund in the country, sustained, with no bad years. That does not make them false. It makes them a question.
What people leave out
CAGR only compares fairly if both sides are on the same footing, and they rarely are.
| Asset | Routinely omitted from the return |
|---|---|
| Property | Stamp duty, registration, brokerage, maintenance, property tax, vacancy |
| Gold | Making charges, storage, purity loss on resale |
| Equity funds | Tax on gains — the expense ratio is already deducted |
| Business | The owner's own time and salary |
| Fixed deposits | Tax at slab rate, which is the largest deduction of all |
Property returns quoted at "12% CAGR" almost never account for the 8–12% of transaction costs going in, the 1–2% coming out, or the maintenance in between. Adjust for those and a lot of confident property comparisons stop being confident.
Put every asset on the same basis — net of costs, net of tax, over the same period — before ranking them. Most comparisons that produce a surprising winner have simply left more costs out of one side.
Three questions
For any CAGR anybody shows you:
Over what period? Three years says little. Fifteen says a great deal.
Starting when? Ask what the same number looks like from a year earlier and a year later. If it moves a lot, the number is describing the market's timing rather than the manager's skill.
Against what? 14% is excellent against a benchmark that returned 9% and unremarkable against one that returned 16%. A fund's CAGR without its index beside it is half a sentence.
Where these ideas come from
The arithmetic is not in dispute. What is worth reading elsewhere is why the industry quotes one number and not the other.
The Securities and Exchange Board of India's investor portal sets out how returns must be presented and what an investor is entitled to be shown, which is the regulatory backing for preferring a compounded rate to a headline gain. AMFI publishes scheme-level performance for the industry, which is where a claimed return can be checked against the category it sits in.
A return quoted without a period attached is not a return. It is a number.
Work it out with the CAGR calculator, which also shows the absolute return alongside so the difference is visible. The ROI calculator handles the same question for non-market investments where you need to include costs yourself, and the inflation calculator converts a nominal CAGR into what it actually bought.